Pitch-class vector
  0   1   2   3   4   5   6   7   8   9  10  11
93 0 74 22 15 143 0 102 1 51 28 2 41 Musical Features
(Modified on 2026-08-11)
1,671 words
In general English, a “feature” is a prominent, conspicuous, and/or distinctive attribute of something (Huron 2001).
- A “feature” of the song A Hard Day’s Night is that it has an unusual opening chord;
- A “feature” of Beethoven’s Ninth Symphony is that it includes a choir;
- A “feature” of Don’t Worry, Be Happy is that all the parts are sung by the same person;
- Etc.
In the field of music information retrieval (MIR), the term “feature” has come to refer to any measurable attribute of something. For example, we could measure the “first chord” of any piece of music and call that a feature. Most pieces of music would have a measurable “first chord” feature; A Hard Day’s Night would have an unusual “first chord” feature.
In music research, “features” are usually measured properties of an audio recording, or sometimes of symbolic encodings. Audio features are (usually) not associated with specific musical events, like “notes”—rather, we’d consider these encodings—, but rather global properties of a recording or time window. However, many MIR researchers will not make such a distinction, calling anything extracted from audio a “feature.”
A feature, like any other measurement, is (or assumes) an operational definition. We can, and should, consider what “construct” we are measuring, and how valid or reliable is it. Researchers often use features assuming that the “music itself” is the actual construct we want to learn about. The feature is a measurement of some property of that audio recording/score. In other cases, features are meant to measure something that a human being would perceive when listening to music.
Generally, there is at least an implicit assumption that we want measurements (features) that correspond in some way to how humans create, experience, or conceptualize the music. For example, a computed audio feature like “danceability” might be intended to measure how much a recording would make a person want to dance. This is sometimes framed as “perceptual correlates” of features. Just like psychological measurement items, there have been many studies to investigate how different audio features do, or don’t, correlate with human experience.
Ease
The main reason we rely heavily on computational features is that they are relatively easy measurements to take, quickly. We can, for example, compute the spectral centroid of 50,000 audio recordings in a few hours, practically for free. In contrast, using behavioral/self-report techniques to gather comparable data could take years, and costs tens of thousands of dollars.
Reliability
In many cases, the perceptual or ecological validity of audio features is very unclear. However, as computational musical measurements, usually based in deterministic calculations, these features can be measured very reliably. Given an encoding of music, we will measure the same result every time. This reliability can make a feature useful even if we won’t know (or care) what it “really” measures, especially when it can be quickly computed.
Consider the task of audio genre identification. In many use cases, we might simply want a tool that will classify a track’s genre “correctly.” Any reliable measurement which supports this task could be useful, whether or not the measurement corresponds to human experience or cognition. If we find a reliable feature that helps us predict the correct genre, who cares what it represents? The construct validity of the feature is irrelevant.
However, “genre” is a (fuzzy) human conceptual category. It is plausible that, generally, measurements which reflect human genre cognition will do better at the task than those that don’t. Of course, the “correct” answer is arrived at in the first place by asking humans! We might alternatively see genre classification as an opportunity to study how humans classify genres, or how music making reflects ideas like genre. In this case, we might view “genre labels” as a measurement of musical features, and study what musical features humans associate with different genres.
Symbolic Features
A classic example of a symbolic data feature is the pitch-class vector. We simply tally each of the 12 pitch classes within a piece, getting twelve numbers (a 12-dimensional feature). Here is the pitch-class vector for Hey Jude (the entire song):
Pitch-class vectors have been shown to be useful measures for estimating the key of a piece. You can correlate a pieces pitch-class vector with each of 24 possible major and minor keys, and take the highest correlation as the key. In the 1980s, Krumhansl and Kessler (1982) did extensive human-participant work to discover listeners’ implicit knowledge of the “tonal hierarchy” of keys in Western music. These profiles can be compared to empirically measured pitch-class vectors from music. The original Krumhansl-Kessler profiles are these:
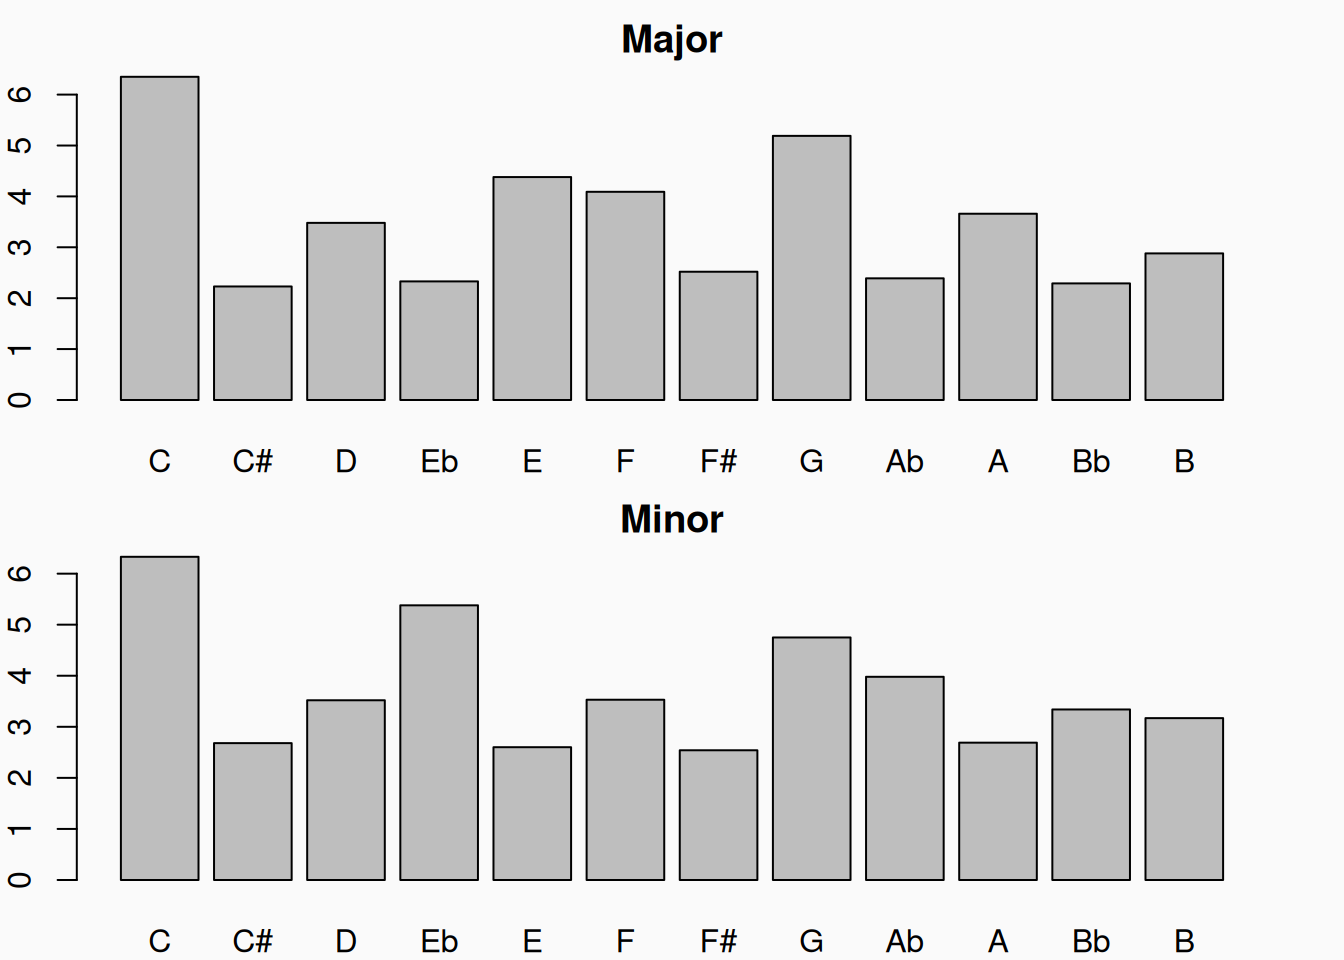
If we correlate our Hey Jude pitch-class vector (see Encoding chapter)with these profiles for each key, we see this:
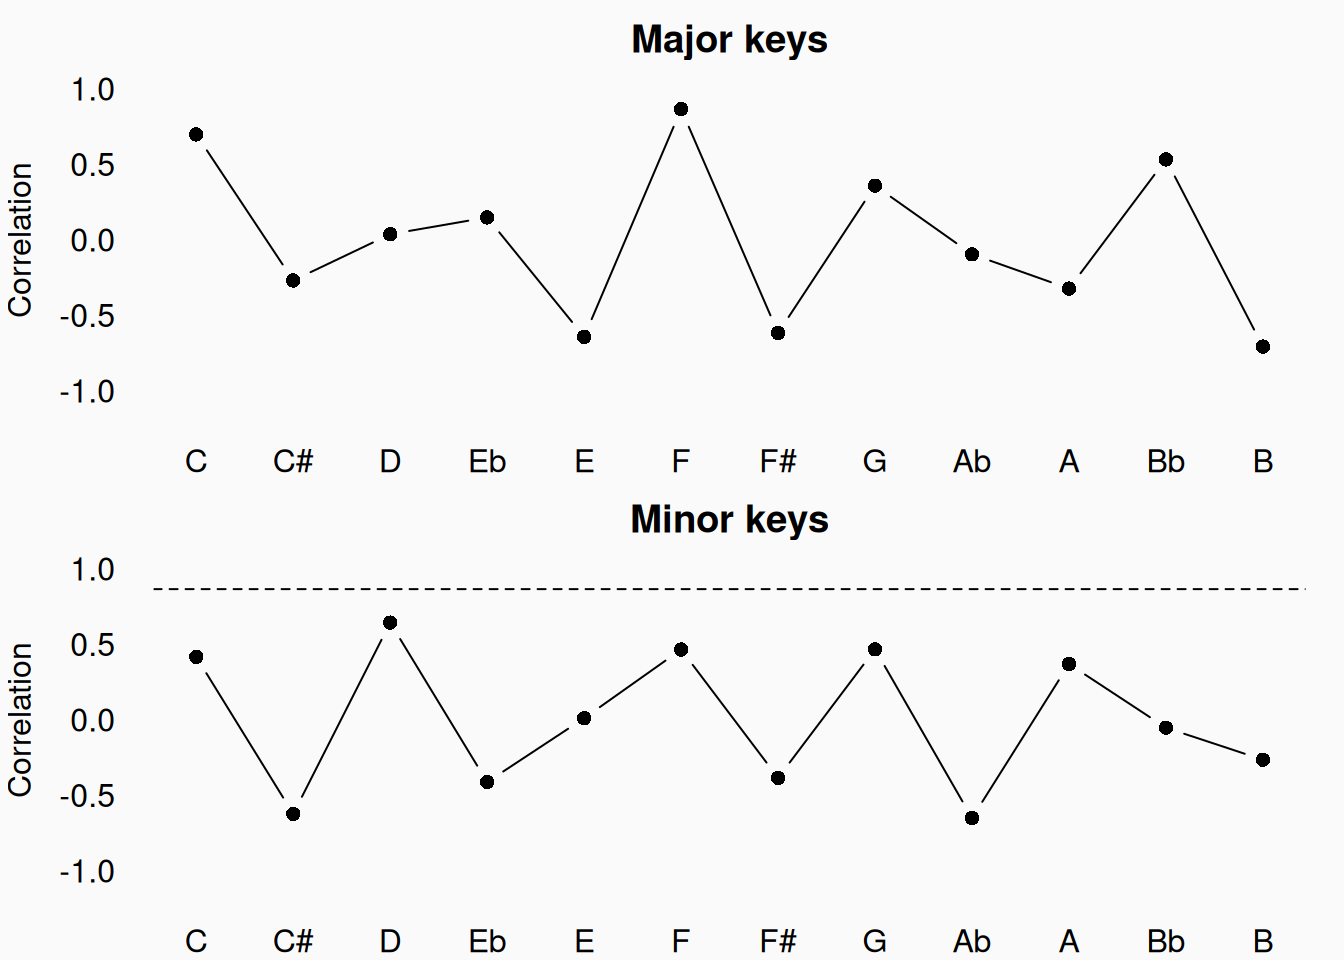
Sure enough, the highest correlation is with F major, which is the correct key of Hey Jude. The “key” of a piece of music may itself be regarded as a feature of the music—whether inherent to the music itself or perceived by a listener. Since many pieces of music change key, measuring when keys change adds a whole nother level of complexity.
If, instead of using an algorithmic approach like this to identify key, we hired a music expert to listen to the song and tell us the key, we’d call this an annotation. However, whether done by hand or by computer, the key is a feature of the piece.
Audio Features
Many features used in music research are computed directly from audio recordings. The most basic is any measure of the audio signal strength, to act as a perceptual correlate of “loudness.” The most common approach is to calculate the root mean square (RMS) deviation of the signal from the baseline, and to represent this on a decibel scale (dB). To better approximate human judgments of loudness, the frequency content is often weighted to match human sensitivity to different frequencies, resulting in “weighted” decibels, with the “A-weighted” dBA being the most common.
The audio equivalent to the (symbolic) pitch-class vectors above is the audio chromagram:
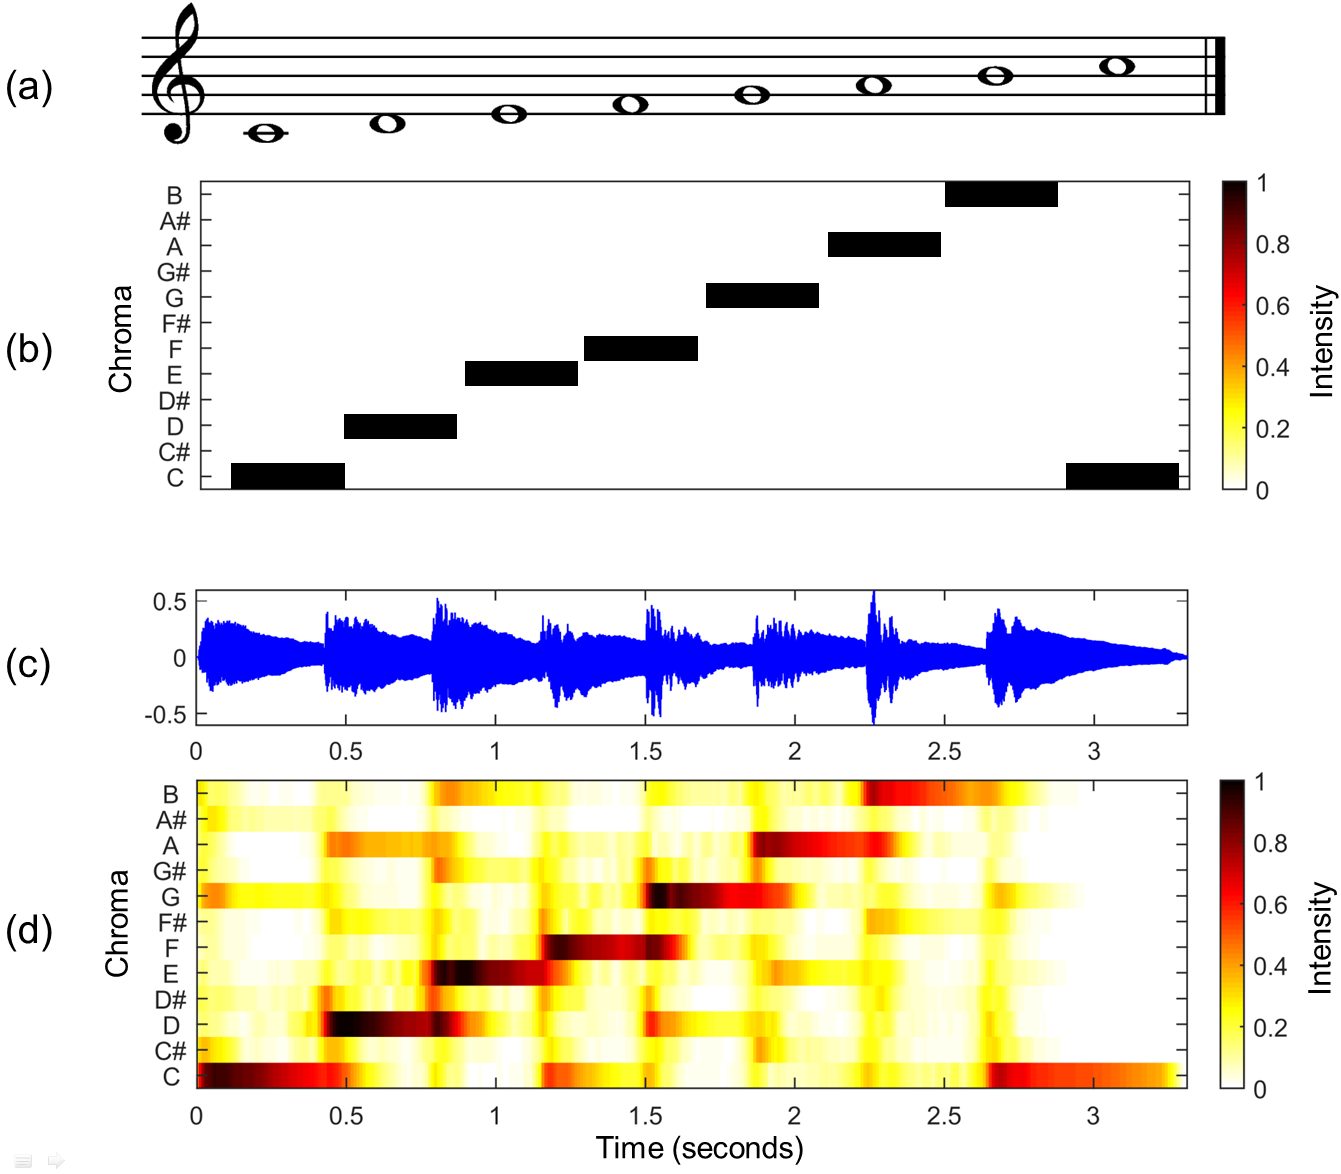
The chromogram, like many audio features is derived from the audio spectrogram, which shows the frequency content of the audio across time. However, a chromagram “wraps” frequency space into octaves, to reflect pitch chroma.
A spectrogram is an extremely “raw,” qualitative, measure, with lots of information in it, which in turn can make it difficult to interpret or analyze directly. Other features derived from the spectrogram include things like the spectral centroid, which has been shown to have a robust connection to the human perception of the “brightness” of a sound (Grey and Gordon 1978), and the Mel-frequency cepstrum (MFC). The MFC is based on the perceptually-derived Mel scale, and is often used as an input representation of audio for MIR tasks.
Timing
Most audio or symbolic features can be computed across flexible spans of musical time. In some applications, we calculate a feature globally for an entire piece, as we did with Hey Jude above. However, we can also calculate features across smaller segments of pieces. By using small segments (\(100\)-\(5,000_{ms}\)) we can hope to approximate real-time human experience of music. In many cases, features are calculated across “rolling windows,” which overlap. Such windows have a window size and a hop size, the latter being the amount each new window is shifted from the previous window. If the hop size is less than the window size, the windows will overlap. The audio spectrogram is a prominent example of a feature computed across time, by computing the Fourier transform of the signal in rolling windows.
Windows
Above we used pitch-class vectors to estimate the key of the song Hey Jude. However, the bridge of Hey Jude (arguably) modulates to the key of Bb. We might be able to capture this change using rolling windows. For example, we could calculate the pitch-class vector for rolling eight-measure windows, with a hop size of one measure.
Note that the choice of window size and hop size has a huge effect on the result. If the window size is too large, we get more information in each window (each measurement), but less precise timing information. If we use smaller windows, we get better time accuracy but less information in each measurement. If we used one-measure windows in Hey Jude, we would measure the key changing with nearly every bar—following the chord changes, not key changes. Spectrograms always balance the frequency resolution (detail) with time resolution. In a DAW, or on a mixing board, the meters (lights) work by computing the RMS signal level across rolling windows, with different window sizes used for different tasks—for example, smaller windows are used to find peaks and slower windows (\(\approx 300_{ms}\)) to estimate perceived loudness. Note that we can also apply functions to interpolate the overlapping parts of our rolling windows.
Parameterization
Most musical/audio features have more than one way to calculate them—different parameters that we the researchers choose. What window sizes and hop sizes do we use, and how should the overlapping regions be treated? Should frequency be log-scale, or perhaps put on the Mel scale? In a pitch-class vector, should all notes be counted equally, or should they be weighted to match the duration of the notes? Should repeated notes be counted? Etc. These decisions, and others like them can have a huge impact on our results.
One thing I hate to see in research is people not explaining what parameter values they used, or why. Very often, researchers use existing coding libraries (in Python, Matlab, etc.) to compute audio features, and simply use the default values. If you don’t mention what parameters you use—for example, what window size is used in your spectrograms—, it suggests that you haven’t even thought about the parameter, or the effect it might have on the measurement’s construct validity. It may be that your software package’s default parameters are a fine choice, but it is a good idea to show your readers/reviewers that you have thought through these details.